
CMS · FEDERAL MEDICAID FUNDING
Medicaid
Follow federal Medicaid funding for medical care and program administration across states and territories.
Numbers tell a bigger story.
Week starts Monday · YTD starts January 1 · UTC. All-time history is not yet available.
A constant historical pace, not payments recorded today. State-funded Medicaid spending is excluded.
FOLLOW THE MONEY
Where Medicaid funding goes
States and territories, ranked by federal Medicaid spending. Explore each destination for care and administration.
This breakdown covers Medicaid only: federal medical assistance and administration. State-funded shares, CHIP, research and other Health-function programs are excluded. It is not a state allocation of the broader Treasury Health function.
Baseline: Fiscal year 2024 · Official historical observations

California
#1 · FEDERAL MEDICAID SHARE

New York
#2 · FEDERAL MEDICAID SHARE

Texas
#3 · FEDERAL MEDICAID SHARE

Pennsylvania
#4 · FEDERAL MEDICAID SHARE

Ohio
#5 · FEDERAL MEDICAID SHARE

North Carolina
#6 · FEDERAL MEDICAID SHARE

Florida
#7 · FEDERAL MEDICAID SHARE

Illinois
#8 · FEDERAL MEDICAID SHARE

Michigan
#9 · FEDERAL MEDICAID SHARE

Arizona
#10 · FEDERAL MEDICAID SHARE

Massachusetts
#11 · FEDERAL MEDICAID SHARE

New Jersey
#12 · FEDERAL MEDICAID SHARE

Virginia
#13 · FEDERAL MEDICAID SHARE

Kentucky
#14 · FEDERAL MEDICAID SHARE

Indiana
#15 · FEDERAL MEDICAID SHARE

Washington
#16 · FEDERAL MEDICAID SHARE

Louisiana
#17 · FEDERAL MEDICAID SHARE

Oregon
#18 · FEDERAL MEDICAID SHARE

Missouri
#19 · FEDERAL MEDICAID SHARE

Minnesota
#20 · FEDERAL MEDICAID SHARE

Maryland
#21 · FEDERAL MEDICAID SHARE

Georgia
#22 · FEDERAL MEDICAID SHARE

Tennessee
#23 · FEDERAL MEDICAID SHARE

Colorado
#24 · FEDERAL MEDICAID SHARE

Wisconsin
#25 · FEDERAL MEDICAID SHARE

South Carolina
#26 · FEDERAL MEDICAID SHARE

Oklahoma
#27 · FEDERAL MEDICAID SHARE

Connecticut
#28 · FEDERAL MEDICAID SHARE

New Mexico
#29 · FEDERAL MEDICAID SHARE

Arkansas
#30 · FEDERAL MEDICAID SHARE

Iowa
#31 · FEDERAL MEDICAID SHARE

Alabama
#32 · FEDERAL MEDICAID SHARE

Mississippi
#33 · FEDERAL MEDICAID SHARE

Nevada
#34 · FEDERAL MEDICAID SHARE

Puerto Rico
#35 · FEDERAL MEDICAID SHARE

West Virginia
#36 · FEDERAL MEDICAID SHARE

Utah
#37 · FEDERAL MEDICAID SHARE

Kansas
#38 · FEDERAL MEDICAID SHARE
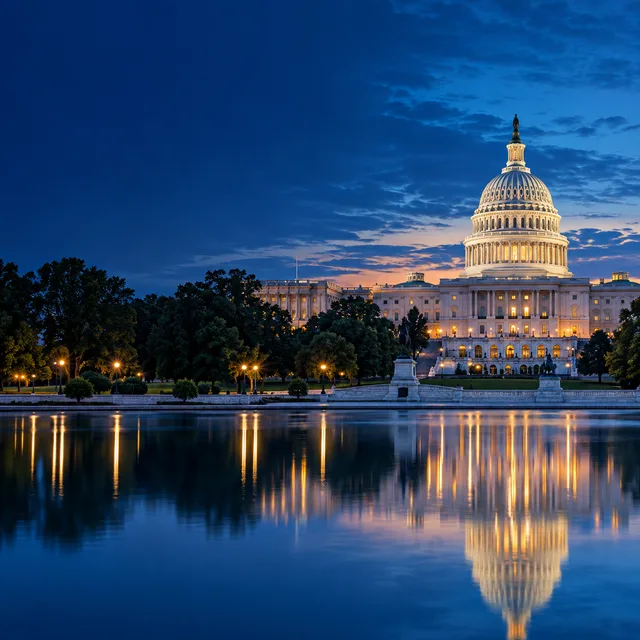
District of Columbia
#39 · FEDERAL MEDICAID SHARE

Maine
#40 · FEDERAL MEDICAID SHARE

Idaho
#41 · FEDERAL MEDICAID SHARE

Nebraska
#42 · FEDERAL MEDICAID SHARE

Rhode Island
#43 · FEDERAL MEDICAID SHARE

Hawaii
#44 · FEDERAL MEDICAID SHARE

Delaware
#45 · FEDERAL MEDICAID SHARE

Alaska
#46 · FEDERAL MEDICAID SHARE

Montana
#47 · FEDERAL MEDICAID SHARE

New Hampshire
#48 · FEDERAL MEDICAID SHARE

Vermont
#49 · FEDERAL MEDICAID SHARE

South Dakota
#50 · FEDERAL MEDICAID SHARE

North Dakota
#51 · FEDERAL MEDICAID SHARE

Wyoming
#52 · FEDERAL MEDICAID SHARE

Guam
#53 · FEDERAL MEDICAID SHARE

U.S. Virgin Islands
#54 · FEDERAL MEDICAID SHARE

Northern Mariana Islands
#55 · FEDERAL MEDICAID SHARE

American Samoa
#56 · FEDERAL MEDICAID SHARE
How these numbers work
CMS Medicaid Financial Management Report, federal share only, medical assistance plus administration. Excludes CHIP and state shares. Fiscal year 2024; compare separately with Treasury net outlays. Models expire 2027-01-01.
Running amounts apply a constant historical pace: the reported amount divided by every second in Fiscal year 2024, multiplied by elapsed time in the selected range. They illustrate the flow; they do not track actual transactions today. Week starts Monday and YTD starts January 1, in UTC. Dollar increments show motion, not dollar-level measurement accuracy.
“Reported period” restores the original source amounts. This pace model freezes at 2027-01-01 unless a newer official snapshot is imported. These program snapshots have their own reporting periods and coverage, which differ from the national Treasury budget-function counter.
Official sources, versions & audit trail
Fiscal year 2024
Retrieved 2026-10-23 · Archived source
Version: wn-spending-breakdowns-v1. Source-file SHA-256 checksums, original observations and the model are included in the audit download. Illustrative images are AI-generated and do not identify actual recipients, facilities or contract work.
Download data & auditKeep exploring
See how other areas of federal spending compare.

Social Security
Retirement, disability & survivors

Net Interest
The cost of federal borrowing

Medicare
Health coverage for eligible people

National Defense
Military & defense activities

Income Support
Assistance & income protection

Veterans’ Benefits
Care & support after service

Transportation
Roads, airways & waterways

Law & Justice
Courts, enforcement & corrections

Education & Social Services
Schools, skills & social services

Community Development
Communities & disaster recovery

Environment & Resources
Land, water & conservation

Agriculture
Farming & agricultural services

International Affairs
Diplomacy & international assistance

Science & Space
Research & space exploration
Government Operations
Running the federal government

Energy
Supply, conservation & preparedness

Commerce & Housing Credit
Credit, insurance & commerce
1 of 17 · Social Security